E-ISSN:2320-8686
P-ISSN:2321-127X

Research Article

Analysis

International Journal of Medical Research and Review

2019 Volume 7 Number 6 November-December
Publisherwww.medresearch.in

Analysis of central axis and build up region dose calculated by different dose calculation algorithms used for radiation treatment planning

Santhosh V.S.1*, Vishnu R.2
DOI: https://doi.org/10.17511/ijmrr.2019.i06.14

1* Santhosh V.S., Assistant Professor, Department of Radiation Physics, Government Medical College, Thiruvananthapuram, Kerala, India.

2 Vishnu R., Assistant Professor, Department of Radiation Physics, Government Medical College, Thiruvananthapuram, Kerala, India.

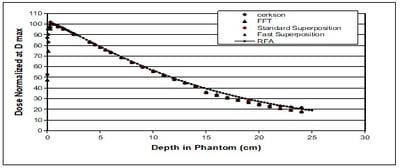
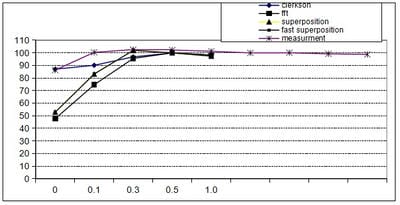
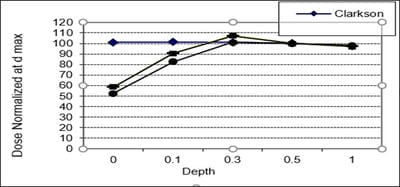
Introduction: Computerized Treatment planning system (TPS) is an integral part of radiation treatment procedure. The main part of treatment planning system is a calculation algorithm incorporated in the Treatment Planning System. Various algorithms used in the TPS have capabilities and limitation on specific situations. Oobjective: The objective of the work is to analyse the depth dose distribution generated by different dose calculation algorithms used in TPS in regions of low and high dose gradient. Materials and Methods: Four different dose calculation algorithms used for treatment planning such as Modified Clarkson, Sector integration, Fast Fourier Transform, Convolution- Superposition algorithm was used to generate the percentage depth dose distribution in a water phantom up to 25 cm depth. The values are compared with experimental results using Radiation Field Analyser. The PDD values also generated at build up region and the values were compared with experimental results using a Parallel plate ionization chamber. Rresults: The results show that the dose calculated by different algorithms shows difference at build up region and at larger depths. Conclusion: In the study, it was observed that the algorithms are reliable at the regions of dose uniformity, but care should be taken to interpret the dose distribution at the regions dose inhomogeneity.

Keywords: Radiation field analyser, Modified clarkson, Sector integration

Corresponding Author How to Cite this Article To Browse
Santhosh V.S., Assistant Professor, Department of Radiation Physics, Government Medical College, Thiruvananthapuram, Kerala, India.
Email:
Santhosh VS, Vishnu R. Analysis of central axis and build up region dose calculated by different dose calculation algorithms used for radiation treatment planning. Int J Med Res Rev. 2019;7(6):536-542.
Available From
https://ijmrr.medresearch.in/index.php/ijmrr/article/view/1115

Manuscript Received Review Round 1 Review Round 2 Review Round 3 Accepted
2019-11-14 2019-11-24 2019-11-30 2019-12-05
Conflict of Interest Funding Ethical Approval Plagiarism X-checker Note
No Nil Yes 6%

© 2019 by Santhosh V.S., Vishnu R. and Published by Siddharth Health Research and Social Welfare Society. This is an Open Access article licensed under a Creative Commons Attribution 4.0 International License https://creativecommons.org/licenses/by/4.0/ unported [CC BY 4.0].

Introduction

Radiation Therapy involves the treatment of cancer using ionizing radiation. The Primary aim of radiation treatment is to deliver a very accurate absorbed dose to a well-defined cancer site called target volume with minimal radiation dose to the surrounding normal tissues.

The dose delivered to the target volume and surrounding tissues can be estimated by a computerized treatment planning system(TPS). With the use of TPS optimum radiation beam parameters was selected and was determine to absorbed dose distribution that will result in the patient body from the selected incident radiation beams.

The main component of a treatment planning system is a dose calculation software system, which uses a set of measured or derived data of the radiation beams that is used for treatment. A calculation algorithm then applies this data to calculate the absorbed dose in a specific clinical situation. The functionality and quality of TPS dependent on the type of algorithms used in that particular TPS.

Different algorithms are in use in for this purpose. These algorithms can be classified in to two such as correction-based algorithms or model-based algorithms [1]. In correction-based algorithm the dose distribution in water is first reconstructed from measured data and then correct to account for the actual treatment conditions. Model based algorithms derive the dose distribution using physical descriptions of the treatment beam and the energy deposition within the patient.

The algorithms have inherent limitations and advantageous for predicting the dose distribution within the patient. For an efficient Treatment planning the TPS should predict the dose at any point within the patient accurately. However, there are different regions and points within the patient where large dose gradients present, the dose predictions become difficult or inaccurate [2,3].

The dose accumulated at the boundary between the air and the patient's skin is known as the surface dose. The dose deposited within the first few millimetres of skin depth varies considerably due to the build-up character of the photon beam. The region between the surface and the depth of dose maximum is generally referred to as the build-up region.

A high dose gradient can be seen in the build-up region and the estimation of dose at the build-up region has some inherent uncertainties due to absence of Charge Particle Equilibrium. However, the dose at this region is significant in many clinical situations especially for those tumors volumes close to skin surface [4]. An ideal TPS should calculate the dose in this high dose gradient regions accurately.

However, it was reported that the accuracy of dose calculation at the high dose gradient regions is different for different TPS algorithms. The American Association Physicists in Medicine (AAPM) task group recommends the dose distribution generated by treatment planning systems in these regions should be analysed separately for accuracy of dose calculation done by different algorithms [5].

Material and Methods

Study setting: Department of Radiation Oncology, Government Medical College, Thriuvananthapuram.

Type of study: Experimental study.

Sampling method: The dose values calculated by dose calculation algorithms are compared with measured results using descriptive statistics. The difference between the calculated and measured doses is calculated in percentage as

ijmrr_1115_01.jpg

Study duration: December 2017 to January 2019.

Ethical consideration & permission: Permission obtained from the institution

Study tools: A computerized treatment planning system with multiple dose calculation algorithms was used in this study. Radiation field analyser with 0.01cc chamber volume used for the comparison of TPS generated dose values with measured values. A parallel plate ionization chamber and perspex sheets of variable thickness used to measure the dose values at build up region. The dose calculation algorithms used for radiation treatment planning were analysed for the dose predication at a dose uniform region and high dose gradient region in a tissue equivalent medium. The algorithms, analysed were Modified Clarkson algorithm, Fast Fourier


Transform (FFT) algorithm standard Superposition algorithms and Fast superposition algorithm.

The Modified Clarkson algorithm uses patient data, treatment machine data and set up information to simulate dose distribution inside the patient. The patient data consist of relative electron density information that represents a section of patient. These will have previously been generated by assigning density values to area enclosed by traced contours or by applying the CT to relative electron density conversion to patient data. The machine data consists of a set of Tissue air ratio or modified Tissue Phantom Ratio values and a set of diagonal Off Centre Ratios (OCR).

Other algorithms are similar in that they both compute the dose by convolving the total energy released in the patient with Monte Carlo generated energy deposition kernels computed by Makie et al. In Fast Fourier Transform the energy deposition kernels are interpolated from spherical to Cartesian coordinate on a common grid while superposition calculations are done in the beam coordinate, and beam coordinate is interpolated to the user specified calculation volume.

Study design: To assess the accuracy of a dose calculation algorithm, the simplest way is to perform dose value computation with the dose calculation algorithms and then compare the computed dose values with measured results. First step of our analysis was modelling a water phantom of 30 x30 x30 cm3 volume in the treatment planning system. Water medium was selected because of its tissue equivalence. After modelling the rectangular water phantom sets of interest points where selected along the central axis of the phantom at an interval of 1 cm. The TPS has an option for modelling the radiation beam of different energy and filed sizes. Here the energy of radiation was selected as 1.25 MeV which is the average energy of cobalt 60 beam commonly used for radiation treatment.

The dose calculations were performed at the selected interest points with four different algorithms mentioned above. The calculated dose values values were normalized at the dose value obtained at the depth of maximum dose (d max). The calculations are done for three rectangular fields such as 5x5, 10x10 and 30x30. For all calculations the Source to Surface Distance was selected at 80 cm-the normal clinical treatment distance. After the dose value computation with the algorithms the experimental validation was done.

The measurements were carried out using a radiation filed analyser having an ionization chamber of 0.01cc volume. Dose values were measured at the corresponding interest points modelled in the TPS.

Dose build up region studies: The dose accumulated at the boundary between the air and the patient's skin is known as the surface dose. The dose deposited within the first few millimetres of skin depth varies considerably due to the build-up character of the photon beam. The region between the surface and the depth of dose maximum is generally referred to as the build-up region. A high dose gradient can be seen in the build-up region and the estimation of dose at the build-up region has some inherent uncertainties due to absence of Charge Particle Equilibrium. However, the dose at this region is significant in many clinical situations especially for those tumors volumes close to skin surface. An ideal treatment planning algorithm should predict the dose at the build-up region accurately. To investigate the build-up region dose calculation capabilities, the present study generated depth dose curves from beam entry point to a depth of I cm in the phantom along the central axis. The spacing between interest points is 1 mm. The calculated results were analysed and compared with the actual measured data in order to establish a correlation. The TPS generated values are compared with measured values using a parallel plate ionization chamber. Build up increment of 1mm was achieved by adding 1mm thick phantom sheets above the parallel plate ionization chamber. The present study investigated the build-up region behaviour for 5cmx5cm,10cmx10cm and 30cmx30cm field sizes. All measurements were carried out with international Atomic Energy Agency (IAEA)TRS 398 recommended scatter conditions.

Data analysis: The Radiation dose calculated by the Dose calculation algorithms at the selected interest points were

Results

Central axis percentage Depth Dose: The Percentage depth dose values calculated by the four dose calculation algorithms were plotted as a function of depth to obtain the PDD curves. PDD curves were plotted for 5cm×5 cm, 10cm×10cm and 30cm×30cm field sizes. The measured PDD values for the same field sizes were also plotted to obtain measured PDD curves.


The calculated and measured PDD curves for reference 10 x10 cm2 Field size at 80 cm source to surface distance (SSD) have been shown in Figure 1. The values are equal for depth up to 5 cm and the difference was less than 1.5 % up to depth 15 cm for all algorithms. At depths beyond 15cm, the present study observed a variation from calculated to measured values. Similar trends are observed for 5cmx5cm and 30cmx30cm fields.

ijmrr_1115_02.jpg

Fig-1: The calculated and measured PDD curves for reference 10 x10 cm2

Field size at 80 cm source to surface distance (SSD).

Percentage Depth Dose values calculated by four algorithms and measured values for field size 10cm x10cm

Build up region results: Table 1 shows the the depth dose values in percentage calculated at build up region by the four algorithms and measured values.

Table-1: Depth dose values calculated at build up region for 10cm x 10cm filed size

Depth Clarkson FFT Super position Fast superposition Measurement
0 87.07 47.74 52.9 52.9 86.3
0.1 90.15 74.7 83.16 83.26 100.4

ijmrr_1115_03.jpg

Fig-2: PDD curves at build up region for 10cmx10cm filed size.

Figure 2 shows the PDD curve generated at build up region by the four algorithms for a filed size 10cm x10cm.

All calculated values were normalized to dose at reference depth dmax. to obtain the normalized surface dose. The dose values calculated at 0 depth and 0.1cm depth by the algorithms and measurement are given in table1.

For the field size of 10cmx10cm the normalized dose calculated by Clarkson algorithm at 0 depth is 87% of dose at reference depth, while it is 47% for Fast Fourier Transform (FFT) algorithm and 52.9% for Superposition and Fast superposition algorithm. At Depth of 0.1 cm the doe values are 90.15, 74.7, 83.16. and 83.26 while the measured value is 100.4 %.

The PDD curves calculated for 30 cmx30cm field size generated by four algorithms were compared and shown in figure 3. For 30cmx30cm fields the normalized surface dose calculated by Clarkson algorithm is 101% and for Fast Fourier Transform (FFT) is 52.41%. The normalized surface dose calculated by Superposition and Fast Superposition algorithm are 58.49 %and 58.54% respectively.

ijmrr_1115_04.jpg

Fig-3: Depth dose values calculated at build up region for 30x 30 filed by four algorithms.

Discussion

Treatment planning system is a very important component for the accurate prediction of dose delivered to patient undergoing cancer treatment. Different dose calculation algorithms are in use for this purpose. The calculation accuracy dependent on the type of algorithms used in the TPS [6,7]. Different algorithms commercially used for the planning purpose and it was reported that the available dose calculation algorithms have its of limitations and advantageous [8].

The reason for this is the deference in modelling employed by these algorithms. Some algorithms produce high accuracy, but the computational time will be too high. The limitation of the algorithms is predominant at the regions of high dose gradient regions [5,9,10].


In the present study, the percentage depth dose values were compared and calculated by four algorithms and also compared with the results with measured values at depths beyond Dmax at the central axis region, there will be a dose homogeneity. At this region it was expected that the dose values calculated by all algorithms were same and should be in agreement with experimental result.

The present study clearly shows that at the regions of dose uniformity the dose values calculated by all the algorithms are in good agreement with the measurement and each algorithm give comparable results. The AAPM task group recommends the acceptability of dose calculation should be with 1.5% of measured values. In the present studies the dose values calculated by all four algorithms are with in this recommended limit at the region of dose uniformity.

The difference was in the range of 0.7-1.5% for depth up to 15 cm. For routine clinical practice the usual treatment planning depths are all within this range. Many investigators studied the dos calculation accuracy of different dose calculation algorithms and reported similar result at the region of dose homogeneity [11,12,13].

Knöös et al conducted a study of the performance of five commercial radiotherapy treatment planning systems. The systems cover dose calculation techniques from correction-based equivalent path length algorithms to model-based algorithms and reported that the dose calculation done by five algorithms in the homogeneous medium at central axis were in in good agreement with each other [14].

It has been reported that algorithms may produce errors in presence of heterogeneous media in complex system, whilst reliable in simple situation in homogeneous media [15]. Kida s et al reported that each dose calculation algorithms showed difference in dose prediction due to difference in modelling approach [16].

Saeed Ahmad Buzdar et al compared pencil beam and collapsed cone algorithms, in radiotherapy treatment planning for 6 and 10 mv photon. The percentage depth dose and beam profiles for 21 treatment fields, for both the calculation systems have been compared and found that both calculation algorithms are in close agreement in most of the field settings [17].

The present study also shows that at the regions of dose uniformity the dose values calculated by all the algorithms are in good agreement with the measurement and each algorithms give comparable results. Abdulhamid Chaikh et al study quantifies the differences in calculated dose computed with two algorithms available in treatment planning systems like Pencil Beam cconvolution and Clarkson and a difference observed for head and neck, brain and prostate cases [18].

The surface Percentage Depth Dose calculated by four algorithms were compared with experimental results at the build-up region. Our studies shows there is disagreement between calculated and measured percentage depth dose values at near surface regions. At the build up region on a surface point) the dose calculated by Clarkson method is around 50% more than that predicted by other algorithms. At near-surface depths the dose calculated by different dose calculation algorithms has been found with a range of variation in many studies and it was reported that there is no algorithm that perfect for all clinical situations [19,20,21,22].

Kesan el al investigated the surface dose calculated by different version of Analytic Anisotropic algorithms and found that the different versions of same algorithms calculate the surface dose distinctively. It was reported that the dose measurement of surface and in the near surface region requires great attention. The most basic reason for this situation is concerned about how accurate the surface measurements to be used for beam modelling are, and which dosimetry system is used [23]. Bilge et. al. measured the surface doses for 5cmx5cm, 10cmx10cm and 20cmx20cm field sizes and the results were found to be 10%, 15% and 35%, respectively [24]. Ying Cao et.al evaluate the superficial dose calculation accuracy of four commonly used algorithms in commercially available TPS by Monte Carlo simulation and film measurements. Surface and build up doses were measured by the group and reported that the algorithms need to be validated for reliability at superficial regions [25].

The present study also showed that at the regions of high dose gradients the algorithms are not standardised for dose calculation. It is recommended that users should evaluate the build-up dose accuracy for their TPS using clinically relevant treatment plans and grid size, because of limitations in the dose algorithm.


It is also recommended that users should evaluate the accuracy in the dose calculation for individual ttreatment pplanning ssystems before the clinical use at the high dose gradient regions [26,27]. Understanding the performance and limitation for individual ttreatment pplanning Systems in the buildup dose calculation would provide helpful information when dose estimation at near-surface depths is needed.

The present study also helped to understanding the strengths and limitations of different dose calculation algorithms used for treatment planning process, which helps the user to diagnose the TPS problems, and in developing Quality Assurance Protocol.

Limitation

The present study analyses the dose calculation capability of four dose calculation algorithms at region of dose uniformity and a region of dose uncertainty. Dose inhomogeneity regions such as bone tissue interfaces, air gaps and field edges didn’t address in the present study.

A phantom study with a real clinical satiation is not undertaken in the present study. The Monte Carlo based calculations are more accurate and reliable when compared to model-based algorithms. Future works may be done comparing the dose calculated by the algorithms with Monte Carlo based calculations.

Conclusion

As conclusions, the presented study reveals that each dose calculation algorithms have limitations in predicting accurate dose. In the study, it was observed that the algorithms are reliable at the regions of dose uniformity, but care should be taken to interpret the dose distribution at the regions dose inhomogeneity. It is advised that the user should understand the limitation of each algorithm before proceeds with treatment planning.

These are to ensure accurate dose estimation to the tumour and normal tissue in order to optimize radiotherapy planning and radiation safety to the patients. The study also helps to understand the strengths and limitations of different dose calculation algorithms used for treatment planning process, which helps the user to diagnose the TPS problems, and in developing Quality Assurance Protocol.

What this study adds to existing knowledge?

Before the commencement of radiation treatment, the planning is done with treatment planning system. The present study provides an understanding about the strength and limitations of the treatment planning systems to the radiation oncology team.

The study also helps to develop a quality assurance protocol for the treatment planning systems used for cancer treatment.

Author’s Contribution

Dr. Santhosh VS was the primary investigator of the study, collected data, Drafting the manuscript. Mr. Vishnu R. helped in collection of data and manuscript preparation.

Reference

  1. Wen-Zhou Chen, Ying Xiao, Jun Li. Impact of dose calculation algorithm on radiation therapy. World J Radiol. 2014;6(11)874-880.
  2. Commissioning and quality assurance of computerized planning systems for radiation treatment of cancer. International Atomic Energy Agency, Vienna. 2004- Technical reports series No- 430.
  3. Animesh. Advantages of multiple algorithm support in treatment planning system for external beam dose calculations. J Can Res Ther. 2005;1(1)12-20.
  4. International Atomic Energy Agency, World Health Organization. Pan American Health Organization, European Society of Therapeutic Radiology and Oncology, IAEA, WHO, PAHO, ESTRO, Absorbed Dose Determination in External Beam Radiotherapy- An International Code of Practice for Dosimetry Based on Standard of Absorbed Dose to Water. International Atomic Energy Agency. 2000.

  1. Fraass B, Doppke K, Hunt M, Kutcher G, Starkschall G, et al. American association of physicists in medicine radiation therapy committee task group 53- Quality Assurance for Clinical Radiotherapy treatment planning. Med Phys. 1998;25(10)1773-1829.
  2. Ahnesjö A, Knöös T, Montelius A. Application of the convolution method for calculation of output factors for therapy photon beams. Medical Phy. 1992;19(2)295-301.
  3. Oelkfe U, Scholz C. Dose Calculation Algorithms, In- Schlegel W, Bortfeld T, Grosu AL, (eds) New Technologies in Radiation Oncology. Medical Radiology (Radiation Oncology). 2006, Springer, Berlin, Heidelberg.
  4. Rana S and Pokharel. Verification of dose calcul ation algorithms in a multi-layer heterogeneous phantom using films. Gulf J Oncolog. 2013;1
  5. Miften M, Wiesmeyer M, Monthofer S, Krippner K. Implementation of FFT convolution and multigrid superposition models in the FOCUS RTP system. Phys Med Biol. 2000;45(4)817-33.
  6. Giraud CJ, Balosso J. Clinical Comparison of Pen cil Beam Convolution and Clarkson Algorithms for Dose Calculation. J Cancer Ther. 2013;4(10)
  7. Fotina, Kragl G, Kroupa B, Trausmuth R, Georg D. Clinical comparison of dose calculation using the enhanced collapsed cone algorithm vs a new Monte Carlo algorithm. Strahlenther Onkol. 2011;187(7)433-441.
  8. Kry SF, Alvarez P, Molineu A, Amador C, Galvin J, Followill DS. Algorithms used in hetero geneous dose calculations show systematic differences as measured with the radiological physics center’s anthropomorphic thorax phantom used for RTOG credentialing. Int J Radiat Oncol Biol Phys. 2013;85(1)e95-e100.
  1. Papanikolaou N, Stathakis S. Dose-calculation algorithms in the context of inhomogeneity corrections for high energy photon beams. Med Phys. 2009;36(10)4765-4767.
  2. Knöös T, Wieslander E, Cozzi L, Brink C, Fogliata A, Albers D, et al. Comparison of dose calculation algorithms for treatment planning in external photon beam therapy for clinical situations. Phys Med Biol. 2006;51(22)5785-807.
  3. Kim YL, Suh TS, Ko SG, Lee JW. Comparison of Experimental and Radiation Therapy Planning (RTP) Dose Distributions on Air Cavity. J Radiol Sci Technol. 2010;33(3)261-268.
  4. Kida S, Bal M, Kabus S, Negahdar M, Shan X, Loo Jr BW, et al. CT ventilation functional image-based IMRT treatment plans are comparable to SPECT ventilation functional image based plans Radiother. Oncol. 2016;118(3)521-527.
  5. Buzdar SA, Afzal M, Todd-Pokropek A. Comparison of pencil beam and collapsed cone algorithms, in radiotherapy treatment planning for 6 and 10 MV photon. Journal of Ayub Medical College Abbottabad. 2010;22(3)152-154.
  6. Chaikh A, Khamphan C, Kumar T, Garcia R, Balosso J. What should we know about photon dose calculation algorithms used for radiotherapy? Their impact on dose distribution and medical decisions based on TCP/NTCP. Int J Cancer Ther Oncol. 2016;4(4)4418.
  7. Chung H, Jin H, Dempsey JF, Liu C, Palta J, Suh TS, et al. Evaluation of surface and build‐up region dose for intensity‐modulated radiation therapy in head and neck cancer. Med Phys. 2005;32(8)2682-2689.

  1. Gerbi BJ, Meigooni AS, Khan FM. Dose buildup for obliquely incident photon beams. Med Phys. 1987;14 (3)393-399.
  2. Lamb A, Blake S. Investigation and modelling of the surface dose from linear accelerator produced 6 and 10 MV photon beams. Physics Med Biol. 1998;43(5)1133-1146.
  3. Higgins PD, Han EY, Yuan JL, Hui S, Lee CK. Evaluation of surface and superficial dose for head and neck treatments using conventional or intensity-modulated techniques. Phys Med Biol. 2007;52(4)1135-1146.
  4. Kesen ND, Akbas U, Koksal C, Bilge H. Investigation of AAA dose calculation algorithm accuracy in surface and buildup region for 6MV photon beam using markus parallel-plate ion chamber. J Xray Sci Technol. 2019;27(2)361-369.
  1. Bilge et, A H Bilge, A Çakır, M Okutan, H Acar. Surface dose measurements with Gaf Chromic EBT film for 6 and 18 MV photon beams. Physica Medica. 2009;25(2)101-104.
  2. Cao Y, Yang X, Yang Z, Qiu X, Lv Z, Lei M, et al. Superficial dose evaluation of four dose calculation algorithms. Radiat Phys Chem. 2017;137;23-28.
  3. Kappas C, Rosenwald JC. Quality control of inhomogeneity correction algorithms used in treatment planning systems. Int J Radiat Oncol Biol Phys. 1995;32(3)847-858.
  4. Van Dyk J, Barnett RB, Cygler JE, Shragge PC. Commissioning and quality assurance of treatment planning computers. Int J Radiat Oncol Biol Phys. 1993;26(2)261-273.