E-ISSN:2320-8686
P-ISSN:2321-127X
RNI:MPENG/2017/74037

Research Article

Sleep Apnea

International Journal of Medical Research and Review

2025 Volume 13 Number 1 Jan-Mar
Publisherwww.medresearch.in

Correlation Between Airway Resistance as determined by R20 and Severity of Obstructive Sleep Apnea as Determined by Apnea-Hypopnea Index in Patients with Obstructive Sleep Apnea

Sasidharan A1*, Fathahudeen A2
DOI:https://doi.org/10.17511/ijmrr.2025.i01.08

1* Aswathy Sasidharan, Postgraduate Resident, Department of Respiratory Medicine, Government Medical College, Trivandrum, Kerala, India.

2 Fathahudeen A, Professor and Head of the Department, Department of Respiratory Medicine, Government Medical College, Trivandrum, Kerala, India.

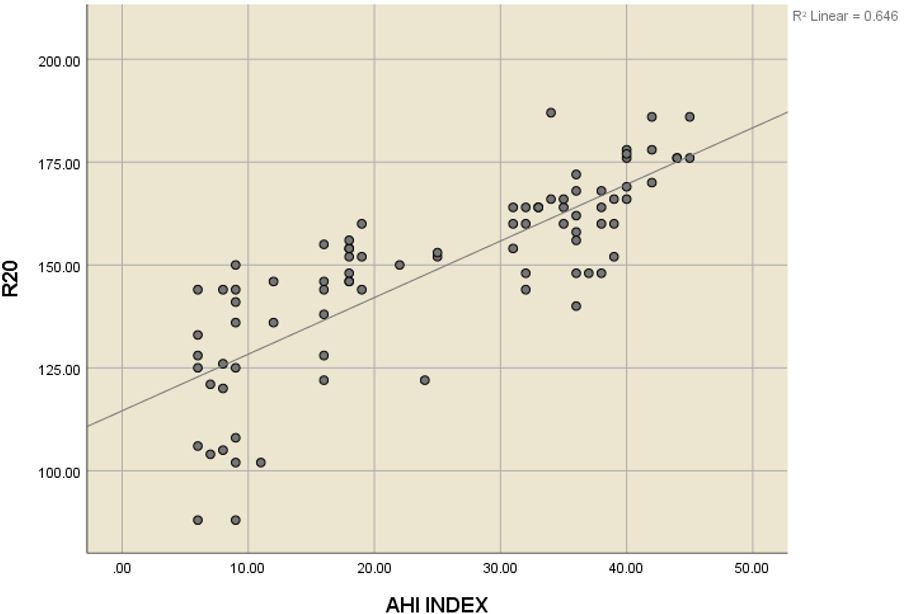
Background: Polysomnography is the gold standard for the diagnosis of patients with obstructive sleep apnea, but its routine use is limited by its cost. R20 measures the resistance of large central airways while R5 corresponds to total airway resistance, in large airway obstruction (as in OSA) central airway resistance (R20) increases and total resistance (R5) increases. This study aims to assess the usefulness of impulse oscillometry in the diagnosis of patients with obstructive sleep apnea, as it is a cost-effective, easy-to-perform investigation.

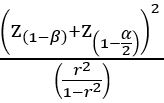
Materials And Methods: The present cross-sectional study included 85 patients suspected to have obstructive sleep apnea. Initial screening was done using the STOP BANG score. Specifically, patients with a score of 0 - 2 are considered at low risk for moderate to severe OSA, while those with a score of 5 -8 are classified as high risk for moderate to severe OSA and in our study those with a score ≥3 was advised to perform sleep study with their AHI index noted and subsequently impulse oscillometry noting their R20, R5 and R5-R20.

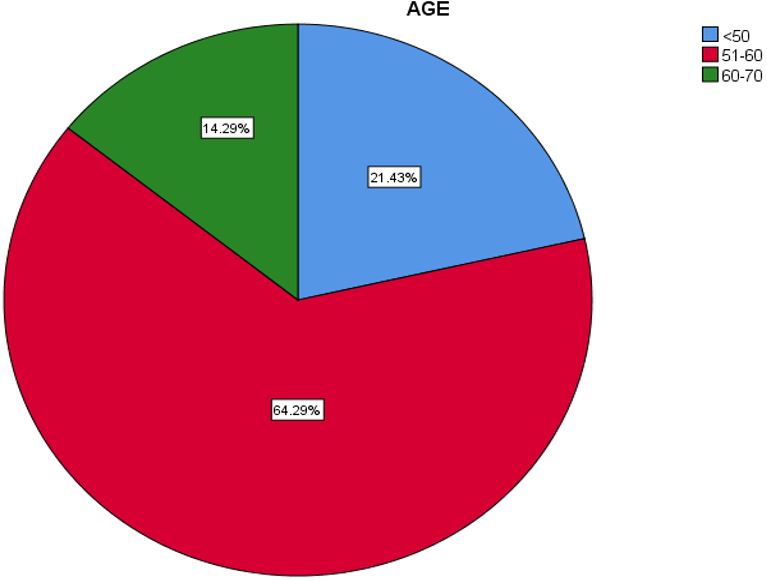
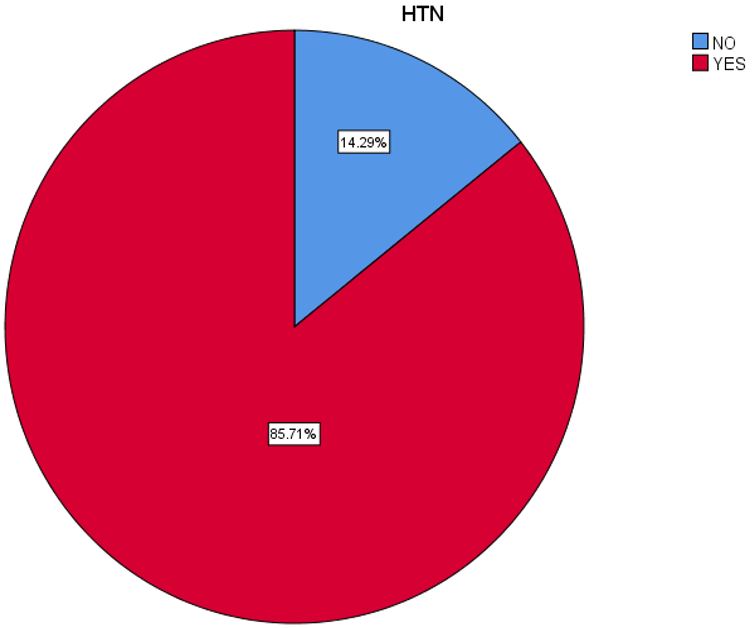
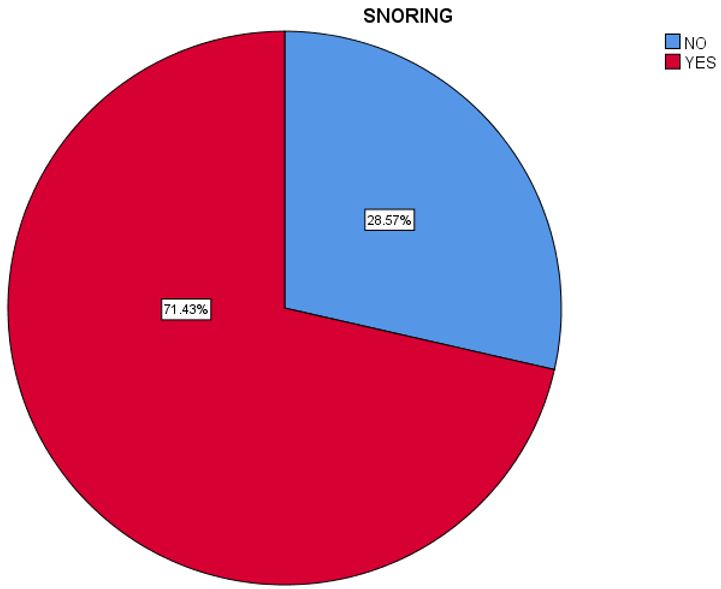
Results: In our study majority of participants (64.3%) fell within the 51-60 age range, which aligns with typical findings indicating a higher prevalence in middle-aged adults. The majority of participants,70 individuals were obese. In our study hypertension was the most prevalent comorbidity associated with OSA Among the 84 study subjects 63.1% of the sample, reported having Type 2 Diabetes Mellitus. 60 participants, making up 71.4% of the sample, reported that they do snore and we demonstrated a good correlation between the severity of OSA and snoring.

Conclusion: Impulse oscillometry can be a useful,easy-to-perform test in the evaluation of patients with OSA though further studies are needed.

Keywords: Obstructive sleep apnea , impulse oscillometry , ahi index

Corresponding Author How to Cite this Article To Browse
Aswathy Sasidharan, Postgraduate Resident, Department of Respiratory Medicine, Government Medical College, Trivandrum, Kerala, India.
Email:
Sasidharan A, Fathahudeen A, Correlation Between Airway Resistance as determined by R20 and Severity of Obstructive Sleep Apnea as Determined by Apnea-Hypopnea Index in Patients with Obstructive Sleep Apnea. Int J Med Res Rev. 2025;13(1):49-55.
Available From
https://ijmrr.medresearch.in/index.php/ijmrr/article/view/1528

Manuscript Received Review Round 1 Review Round 2 Review Round 3 Accepted
2024-12-16 2024-12-26 2025-01-06 2025-01-16 2025-01-26
Conflict of Interest Funding Ethical Approval Plagiarism X-checker Note
None Nil Yes 13.36

© 2025by Sasidharan A, Fathahudeen Aand Published by Siddharth Health Research and Social Welfare Society. This is an Open Access article licensed under a Creative Commons Attribution 4.0 International License https://creativecommons.org/licenses/by/4.0/ unported [CC BY 4.0].

Download PDFBack To ArticleIntroductionMaterials And MethodsResultsDiscussionConclusionReferences

Introduction

Obstructive sleep apnea (OSA)is defined by the presence of repetitive episodes of upper airway obstruction during sleep due to the malalignment at retropalatal and retropharyngeal space [1] which has been graded as mild, moderate and severe according to Apnea Hypopnea Index(AHI) as per polysomnography. The AHI is defined as the sum of apneas and hypopneas per hour of sleep; apnea is defined as cessation of airflow for at least 10 sec [2].OSA is classified as mild(5 to 15 to 30 events/hr), or severe(> 30 events/hr) according to AHI [1]. The STOP BANG score is one of the widely accepted screening tests for diagnosis of OSA. The STOP-BANG questionnaire includes eight variables(yes/no) related to the clinical features of sleep apnea. Scores range from 0 to 8. Based on these scores, patients can be classified according to their risk of obstructive sleep apnea (OSA). Specifically, patients with a score of 0 - 2 are considered at low risk for moderate to severe OSA, while those with a score of 5 -8 are classified as high risk for moderate to severe OSA. The questionnaire demonstrates a sensitivity of 93% for detecting moderate to severe OSA and 100% for detecting severe OSA. [2]. The forced oscillation technique is the general name for airway mechanic measurements using the noninvasive superimposition of pressure fluctuations on the airway over the subject’s normal, quiet, tidal breathing [3]. IOS is a simple, noninvasive method requiring only passive patient cooperation that allows the evaluation of lung function through the measurement of both airway resistance and airway reactance [4]. R20 measures the resistance of large central airways while R5 corresponds to total airway resistance, in large airway obstruction (as in OSA) central airway resistance (R20) increases and total resistance (R5) increases. Our study aims to establish a correlation between R20 and AHI so that the earlier can be tried as an alternative for AHI in the diagnosis of OSA.

Materials And Methods

The study was conducted in the Department of Pulmonary Medicine, Medical College Hospital, Thiruvananthapuram. The present cross-sectional study included suspected cases of OSA. Sleep study and impulse oscillometry were performed in each study subject.

Inclusion Criteria

All consecutive patients with a history of snoring screened using STOP BANG criteria and having a score ≥3 were included in the study.

Exclusion Criteria

All patients with fixed upper airway obstruction due to large retrosternal goitre, post-intubation tracheal stenosis, previous history of tracheostomy

  • COPD patients (can also have coexistent large airway obstruction)
  • Any benign or malignant lung or mediastinal lesion producing tracheal compression on imaging
  • Any history of receiving radiation/surgery to the upper aerodigestive tract
  • History of any caustic ingestion (accidental /DSH)
  • Any history of using hypnotic medicine, including binge alcohol consumption in the night
  • Previous diagnosis of OSA and those on CPAP
  • ICU patients, intubated patients, patients having active TB.
  • Patients not able to perform the required test

Study period: One and a half years after getting Institutional Ethical Committee clearance.

Sample Size

Taking 0.298 as the correlation coefficient (r-value) between R20 and AHI in a study published by Sleep Medicine Center, Southern Medical University, Guangzhou [5], China and substituting r value in the equation, Sample size is estimated using the formula

Sample size n =
ijmrr-1528-06.JPG

If power is 80% β is 0.192, α is 0.05, sample size is 84

Sampling Method: Patients were consecutively recruited till the sample size was reached.

Study Variables

Demographic variables:


  • Age
  • Sex
  • BMI
  • Smoking index

Disease variables:

  • Impulse oscillometry indices like Resistance at 5Hz (R5), at 20HZ (R20), R5-R20 Polysomnography indices like AHI index

Study Definitions

  • R5 (total respiratory resistance) is abnormal, if predicted ≥150 %
  • R20(resistance of large airways) is abnormal and, if predicted is 150 %
  • R5-R20 (resistance of small airways) is abnormal if 0.07 AHI Index is classified as mild(5 to 15), moderate(15 to 30)and severe ( 30 )

Data Collection Tool

Data was collected in a semi-structured questionnaire after taking informed consent.

Data Collection Technique

After obtaining informed written consent, suspected obstructive sleep apnea patients meeting the inclusion criteria attending the OPD of the Department of Pulmonary Medicine, were enrolled in the study.

These patients were interviewed, demographic characteristics and clinical history were noted and an initial screening was done using STOP BANG score. Those with a STOP BANG score were instructed to perform impulse oscillometry and indices mentioned above were noted. The patients were then instructed to perform polysomnography.

Stop Bang Score

The STOP-BANG score is a prevalent screening tool for obstructive sleep apnea (OSA), incorporating eight dichotomous (yes/no) items that reflect clinical features associated with the condition.

The cumulative score spans from 0 to 8, and it stratifies patients according to their OSA risk. Specifically, individuals with a STOP-BANG score ranging from 0 to 2 are categorized as low risk, while those scoring above 3 are deemed at high risk for moderate to severe OSA.

Impulse Oscillometry

Impulse oscillometry was conducted utilizing the Pulmoscan Forced Oscillation Technique device (2022 Cognita Labs, USA), with the data analyzed by the European Respiratory Society's technical standards for respiratory oscillometry [6]. IOS is a straightforward, non-invasive technique necessitating merely passive patient compliance, enabling the assessment of pulmonary function through the quantification of both airway resistance and airway reactance. During measurements, subjects maintained an upright position with their necks comfortably neutral, wore a nose clip, and supported their cheeks to minimise upper airway shunting. A tight seal was ensured between the mouthpiece and lips to prevent air leaks. Tests were repeated at least thrice to ensure reproducible results. Respiratory resistance was measured across an oscillatory frequency range of 5 to 20 Hz using the device‖ algorithm.Parameters included Resistance at 5Hz (R5), Resistance at 20 Hz (R20) and their difference (R5-R20)

Polysomnography

Patients underwent a single night unattended PSG at our department using a portable monitor (EMBLA sleep study system). The following channels were recorded: electroencephalography(EEG), electrooculography (EOG), chin electromyography(EMG), Pulse oximetry, airflow (oronasal flow sensor) respiratory effort (thoracic and abdominal ), sound recordings to measure snoring and body position. The AHI index was noted from the recording.

Data Analysis

Data was analyzed using the statistical package SPSS 26.0 (SPSS Inc., Chicago, IL) and the level of significance was set at p<0.05. Descriptive statistics was performed to assess the proportion of each category of the respective groups. The normality of the data was assessed using Shapiro Wilkinson test. Inferential statistics was done using the chi-square test and Spearman rank correlation test

Ethical Considerations

  • Informed written consent was obtained from the patients.
  • Confidentiality of subjects was maintained throughout the study.

  • No financial burdens were imposed on subjects.
  • The study commenced only after receiving approval from the institute's research committee & institution ethics committee.

Results

In our study majority of participants (64.3%) fell within the 51-60 age range, which aligns with typical findings indicating a higher prevalence in middle-aged adults.(figure1) It is widely acknowledged that obstructive sleep apnea exhibits a significantly greater prevalence among men compared to women., with most population-based studies demonstrating a 2- to 3-fold higher prevalence of OSA in men.

Similar is the case in our study where 54.8% (46 participants ) were male and 38 participants making up 45.2% were females Majority of participants,70 individuals were obese while the rest 14, constituting 16.7% of the total sample, were overweight.

In our study hypertension was the most prevalent comorbidity associated with OSA; the majority 85.7 % (72 participants) reported having hypertension (figure 2).

However, our study failed to obtain a significant association between the AHI index and Hypertension (P>0.05). Among the 84 study subjects 53 individuals representing 63.1% of the sample, reported having Type 2 Diabetes Mellitus while 31 participants, constituting 36.9% of the total sample, reported that they do not have Type 2 Diabetes Mellitus.

60 participants, making up 71.4% of the sample, reported that they do snore and we demonstrated a good correlation between the severity of OSA and snoring with a correlation coefficient (r) of 0.76 (p-value 0.0001(figure 3)(Table 1).

We found a strong correlation between R20 and AHI, with a correlation coefficient (r) of 0.70 (p-value = 0.0001)(figure4). The area under the ROC curve for the severity of OSA(AHI >15) concerning R20 was 0.96, and Sensitivity and Specificity were 0.96 and 0.46 respectively (figure 5). High sensitivity though it aids in diagnosing the disease a lesser specificity makes the test less reliable. This might be partly related to the higher cut-off we set (AHI index >15)

ijmrr-1528-01.JPG
Figure 1: Agewise Distribution Of Study Population

ijmrr-1528-02.JPG
Figure 2
Distribution Of Sample According To Presence Hypertension

ijmrr-1528-03.JPG
Figure 3 Distribution Of Sample Based On Snoring


Table 1: Snoring Vs AHI Index

AHI INDEXTotalP VALUE
5-1515-30>30
SNORINGNO2400240.0001*
YES0204060
Total24204084

P<0.05 is statistically significant.
Pearson correlation test reported a strong positive significant correlation between the R20 vs AHI index (P<0.05).

ijmrr-1528-04.JPG
Figure 4: Positive Correlation Between Ahi Index And R20

ijmrr-1528-05.JPG
Figure 5: Roc Curve

Discussion

Sleep disorders encompass a wide spectrum of conditions that need to be identified, diagnosed, and treated as early as possible because they have a great impact on and serious consequences for general health.

The most common breathing-related sleep disorder is obstructive sleep apnea (OSA).OSA represents a major health problem in the most developed countries. One-seventh of the world's adult population, or approximately one billion people, is estimated to have OSA. Over the past four decades, obesity, the main risk factor for OSA, has risen in striking proportion worldwide. In the past 5 years, the WHO estimates global obesity to affect almost two billion adults.

Several techniques have been introduced to evaluate the pathophysiology of OSA. Of these, nocturnal polysomnography has been suggested as the gold standard diagnostic technique in patients, who suffer from OSA; however, despite its accuracy, time-consuming, expensive, and unfeasible in many institutes and centres. In recent decades, the forced oscillation technique (FOT) has been introduced to be a more user-friendly and applicable technique in the evaluation of respiratory functions and several recent studies have suggested a role for impulse oscillometry in the assessment of severity of obstructive sleep apnea.

In our study on obstructive sleep apnea, the majority of participants (64.3%) fell within the 51-60 age range, which aligns with typical findings indicating a higher prevalence in middle-aged adults. Participants under 50 years old comprised 21.4% of the sample, while those aged 60-70 made up 14.3%. Itay E. Gabbay [7] in a retrospective study examined 26,425 patients in the Technion Sleep Medicine Center during a 10-year study period. Of the patients, 74.3% were men with a mean age of 51.12±13. Although advancing age is a recognized risk factor for obstructive sleep apnea (OSA), research indicates that the severity of OSA may be attenuated in elderly individuals. It is widely acknowledged that obstructive sleep apnea (OSA) exhibits a significantly greater prevalence among men compared to women., with most population-based studies demonstrating a 2- to 3-fold higher prevalence of OSA in men [8]. Similar is the case in our study where 54.8% (46 participants ) were male and 38 participants making up 45.2% were females. This might be perhaps because physicians appear to have a higher index of suspicion for considering the disorder in men [9] and women often do not present with the classical symptoms of OSA (loud snoring, witnessed apneas, increased sleepiness in the day) but instead has poor energy levels and fatigue [10].


Furthermore, the female bed partners of male patients may be more likely to perceive and report snoring or nocturnal breathing abnormalities than male bed partners of female patients. OSA is more prevalent in post-menopausal women than pre-menopausal women, and hormone replacement therapy in post-menopausal women may protect against the disorder. Among 38 females in our study, 32 were postmenopausal signifying the effect of hormonal influence.

In our study 14 participants, constituting 16.7% of the total sample, were overweight. Majority of participants, 70 individuals representing 83.3% of the sample, had a BMI greater than 25, indicating obesity. In our study hypertension was the most prevalent comorbidity associated with OSA; the majority 85.7 % (72 participants) reported having hypertension. 60 participants, making up 71.4% of the sample, reported that they do snore and we demonstrated a good correlation between the severity of OSA and snoring with a correlation coefficient (r) of 0.76 (p-value 0.0001).

Jui-Kun Chiang et al in their meta-analysis demonstrated a significant correlation ( p<0.001) between snoring and AHI as a measure of OSA severity. He also concluded that, as compared to the snoring rate and the snoring index, the snoring intensity, the snoring frequency, and the snoring time interval index were more sensitive measures for the severity of snoring.

The primary aim of our study was to assess the relationship between the apnea-hypopnea index (AHI) and R20. We found a strong correlation between R20 and AHI, with a correlation coefficient (r) of 0.70 (p-value = 0.0001).

In a study by Huiguo Ni Wang et al. [5], which examined impulse oscillometry (IOS) measurements in patients with obstructive sleep apnea, it was demonstrated that both R20 and the range R5-R20 showed a positive correlation with the severity of the disease. Furthermore, the apnea-hypopnea index (AHI) exhibited positive correlations with R5 and R20, with correlation coefficients (r) of 0.66 and 0.86, respectively. The area under the ROC curve for the severity of OSA(AHI >15) concerning R20 was 0.96, and Sensitivity and Specificity were 0.96 and 0.46 respectively. High sensitivity though it aids in diagnosing the disease a lesser specificity makes the test less reliable.

This might be partly related to the higher cut-off we set (AHI index >15) The limitations of our study were mainly attributed to the machine itself; the absence of set reference values in the Indian population makes it difficult to interpret and there exists high intra-subject variability, hence it's mandatory to perform at least 3 tests. Another limitation is the small sample size of our study

Conclusion

In our study, relevant indices in patients with obstructive sleep apnea syndrome (OSAS) were assessed using the impulse oscillometry (IOS) technique, revealing an elevation in R20 among these patients. Furthermore, the level of R20 exhibited a positive correlation with the apnea-hypopnea index (AHI) and the severity of the condition. These findings suggest that upper airway resistance is elevated in OSAS patients compared to normoxic individuals, likely due to anatomical narrowing of the upper airway, which predisposes it to increased obstruction during sleep. While impulse oscillometry, as a simple and non-invasive method, offers a promising alternative to polysomnography, additional research is necessary within the Indian population to establish standardized reference values. Furthermore, studies have highlighted the utility of IOS in guiding therapeutic interventions, particularly in the adjustment of pressure settings during continuous positive airway pressure (CPAP) therapy.

Acknowledgement: I would like to express my deepest gratitude to my guide and co-guide whose unwavering support and expertise have been invaluable throughout this journey. I also extend my heartfelt thanks to all my teachers for their guidance and encouragement. Lastly, I am grateful to my family and friends for their constant support and belief in me, which kept me motivated to complete this work.

Permission from Institutional research board: Yes

Funding: Nil

Conflict of interest: None Initiated

References

1. Fishmans Pulmonary Diseases And Disorders 6th edition. . . . [Crossref][PubMed][Google Scholar]


2. Chung F, Abdullah HR, Liao P. STOP-Bang Questionnaire: A Practical Approach to Screen for Obstructive Sleep Apnea. Chest. 2016 Mar;149(3):631–8. [Crossref][PubMed][Google Scholar]

3. Thompson MJ, Colebatch HJ. Decreased pulmonary distensibility in fibrosing alveolitis and its relation to decreased lung volume. Thorax. 1989 Sep;44(9):725–31. [Crossref][PubMed][Google Scholar]

4. Dubois AB, Brody AW, Lewis DH, Burgess BF. Oscillation mechanics of lungs and chest in man. J Appl Physiol. 1956 May;8(6):587–94. [Crossref][PubMed][Google Scholar]

5. Huiguo L, Wang N, Jianping Z, Shengdao X, Yongjian X, Zhenxiang Z. The diagnosis value and its implication of impulse oscillometry in obstructive sleep apnea syndrome patients. Current Medical Science. 2000 Dec 1;20(4):280–2. [Crossref][PubMed][Google Scholar]

6. King GG, Bates J, Berger KI, Calverley P, Melo PL de, Dellacà RL, et al. Technical standards for respiratory oscillometry. European Respiratory Journal [Internet]. 2020 Feb 1 [cited 2024 Jul 11];55(2). Available from: [Article][Crossref][PubMed][Google Scholar]

7. Gabbay IE, Lavie P. Age- and gender-related characteristics of obstructive sleep apnea. Sleep Breath. 2012 Jun;16(2):453–60. [Crossref][PubMed][Google Scholar]

8. Punjabi NM. The Epidemiology of Adult Obstructive Sleep Apnea. Proc Am Thorac Soc. 2008 Feb 15;5(2):136–43. [Crossref][PubMed][Google Scholar]

9. Evans J, Skomro R, Driver H, Graham B, Mayers I, McRae L, et al. Sleep laboratory test referrals in Canada: Sleep Apnea Rapid Response Survey. Can Respir J. 2014;21(1):e4–10. [Crossref][PubMed][Google Scholar]

10. Young T, Evans L, Finn L, Palta M. Estimation of the clinically diagnosed proportion of sleep apnea syndrome in middle-aged men and women. Sleep. 1997 Sep;20(9):705–6. [Crossref][PubMed][Google Scholar]

Disclaimer / Publisher's NoteThe statements, opinions and data contained in all publications are solely those of the individual author(s) and contributor(s) and not of Journals and/or the editor(s). Journals and/or the editor(s) disclaim responsibility for any injury to people or property resulting from any ideas, methods, instructions or products referred to in the content.