E-ISSN:2320-8686
P-ISSN:2321-127X

Research Article

Diabetes

International Journal of Medical Research and Review

2019 Volume 7 Number 5 September-October
Publisherwww.medresearch.in

Comparison of insulin resistance scoring system with indirect methods of estimating insulin resistance in Indian type 2 diabetes subjects

Kumar R.1*
DOI: https://doi.org/10.17511/ijmrr.2019.i05.04

1* R. Anil Kumar, Associate Professor, Karnataka Institute of Endocrinology and Research, Bangalore, Karnataka, India.

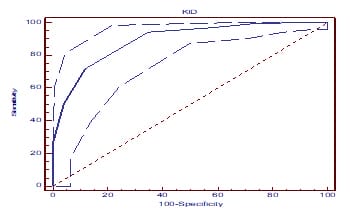
Background: Identification of insulin resistance is very important in management of type 2 diabetes. The euglycemic insulin clamp method, intravenous glucose tolerance tests (IVGTT) and minimal model approximation of glucose (MMAMG) are standard methods of measurement of insulin resistance in research. However, they are impractical in clinical practice and are difficult to perform in population-based research studies. So, a simple scoring system was designed to estimate the insulin resistance. Methods: 200 type 2 diabetes individuals who attended Karnataka Institute of endocrinology and research outpatient department. Fasting plasma glucose, post prandial plasma glucose, fasting insulin, lipid profile, BMI, waist circumference and BP of these subjects were checked. Results: Out of 200 type 2 diabetes subjects 69.5% were males and age group ranging from 26 to 85 years. Duration of diabetes range from 0 to 20 years and 53% of patients had hypertension and 46.5% have hypertriglyceridemia. Insulin resistance calculated by KIER scoring system, HOMA-1, QUICKI, HOMA2 and Fasting Insulin was present in 82%, 63%, 63.5%, 33.5% and 37.5% 0f individuals respectively. KIER scoring system had a statistically significant correlation with HOMA and QUICKY indices. (P value < 0.001) Conclusions: (1) KIER scoring system detects insulin resistance in 82% of type 2 diabetes individuals. (2) HOMA 1 and QUICKI are identical and similarly HOMA 2 and fasting insulin levels are almost identical in estimation of insulin resistance. (3) The KIER scoring system designed is very simple and economical. It takes into consideration the different factors which contribute to insulin resistance.

Keywords: Insulin resistance, HOMA1, QUICKI, Fasting insulin

Corresponding Author How to Cite this Article To Browse
R. Anil Kumar, Associate Professor, Karnataka Institute of Endocrinology and Research, Bangalore, Karnataka, India.
Email:
Kumar RA. Comparison of insulin resistance scoring system with indirect methods of estimating insulin resistance in Indian type 2 diabetes subjects. Int J Med Res Rev. 2019;7(5):361-369.
Available From
https://ijmrr.medresearch.in/index.php/ijmrr/article/view/1081

Manuscript Received Review Round 1 Review Round 2 Review Round 3 Accepted
2019-08-30 2019-09-08 2019-09-14 2019-09-18
Conflict of Interest Funding Ethical Approval Plagiarism X-checker Note
No Nil Yes 7%

© 2019 by R. Anil Kumar and Published by Siddharth Health Research and Social Welfare Society. This is an Open Access article licensed under a Creative Commons Attribution 4.0 International License https://creativecommons.org/licenses/by/4.0/ unported [CC BY 4.0].

Introduction

Diabetes mellitus signifies a series of metabolic disorder sharing the major characteristic of hyperglycaemia. The term insulin resistance indicates the presence of impaired biological response to either exogenously administered or endogenously secreted insulin. Insulin resistance is manifested by decreased insulin stimulated glucose transport and metabolism in adipocytes and skeletal muscle and by impaired suppression of hepatic glucose output [1]. Insulin resistance can occur at skeletal muscle, hepatic and adipose tissue levels. Insulin is a key regulator of glucose homeostasis. Insulin resistance (decreased sensitivity or responsiveness to the metabolic actions of insulin) is determined by both genetic and environmental factors and plays an important pathophysiological role in diabetes Insulin resistance (IR) is a pathological situation characterized by a lack of physiological response of peripheral tissues to insulin action, leading to the metabolic and hemodynamic disturbance [2].

Insulin resistance is used to express the necessity of a dose of insulin administration to suppress hepatic glucose production that can be induced by substrates, glucagon, catecholamine, and so on.

There are two methods used to assess insulin sensitivity: the direct method employs direct insulin infusion and the indirect method does not infuse insulin but, instead, measures insulin concentration. In both methods the status of the measurement is then sub-classified as glucose metabolism that is either stable or unstable [3]. Identification of insulin resistance is very important in management of type 2 diabetes. The euglycemic insulin clamp method, intravenous glucose tolerance tests (IVGTT) and minimal model approximation of glucose (MMAMG) are standard methods of measurement of insulin resistance in research. However, they are impractical in clinical practice and are difficult to perform in population-based research studies [4, 5]. So, indirect methods for assessment of insulin resistance was used. A simple scoring system was evolved to estimate insulin resistance in our outpatient department and compared them with HOMA1, QUICKI, HOMA2 and fasting insulin levels.

Materials and Methods

This study was conducted in 200 type 2 DM patients at Karnataka Institute of endocrinology and research was performed over a period of 6 months.

All the patients were on regular treatment prescribed by their physicians. Informed consent was obtained from all the participants.

The study included patients of age ≥18 years with type 2 diabetes as per the ADA criteria, fasting plasma glucose ≥126 mg/dl and HBA1C ≥6.5%

Type 1 diabetes, Type 2 diabetes individuals on insulin, history of malignancy, hepatic or renal disease, cardiac and chronic liver disease, pregnancy and breast-feeding women were excluded in the study.

Clinical and laboratory data- The detailed history was taken and clinical examination was done by doctors. Anthropometric measurements were done by trained nurses. Weight and height of each participant was measured and the BMI was calculated using the formula body weight in kilograms divided by height in square meters. Waist circumference was measured at the level of midpoint between the lowest margin of the rib and the iliac crest in a standing position. The participants were required to rest for at least 5 minutes before having their blood pressure checked.

Fasting blood samples were collected from an ante cubital vein in plain tubes in the morning after 8 hours overnight fast. Blood glucose was estimated using GOD-POD method. (Hitachi 912 autoanalyser) Fasting insulin was estimated using electrochemiluminescence immunoassay method (Elecys 2010). This assay measures insulin levels between 0.2to1000 micro units/ml. The indirect indices of insulin resistance was measured by using homa 1 described by Mathews, QUICKI index by Katz et al and by homa 2 model calculator released by oxford center for diabetes. Lipid profile was done using hitachy 912 autoanalyser.

1. Homa1 index = Fasting glucose × Fasting insulin / 405 (fasting glucose is in mg/dl).

HOMA-1 index ≥ 2.7 is considered as insulin resistance [6,7].

2. Quantitative insulin sensitivity check index-(QUICKI)

1

= -------------------------------------------------

Log fasting insulin + log fasting glucose

QUICKI ≤ 0.33 considered as insulin resistance [7].


3. Homa 2 value is calculated by homa 2 model calculator released in 2004 by oxford center for diabetes, endocrinology and metabolism [10].

Homa 2 index ≥ 1.8 is considered as insulin resistance [8].

4. Fasting insulin ≥ 12.2 micro units per ml is considered as presence of insulin resistance in this study [9].

Body mass Index (Indians)

  • BMI 23 to 25– overweight.
  • BMI >25 – obesity.
  • BMI > 32.5 requires bariatric surgery

Waist circumference (Indians)

Cut off points for diagnosing obesity

Male>90 cms.

Females > 80 cms

Factors influencing insulin resistance - [11, 12]

  1. Central obesity
  2. Blood glucose.
  3. Plasma insulin levels.
  4. Triglyceride levels.
  5. HDL levels.
  6. Physical activity.
  7. Drugs.

HOMA 1, QUICKI considers only fasting insulin and fasting blood sugar, so they detect predominantly hepatic insulin resistance. So, a simple scoring system was designed which included other factors such as BMI, waist circumference, BP, triglycerides, PPBS to calculate insulin resistance besides FBS and fasting insulin.

Table 1: KIER scoring system to estimate insulin resistance.

Parameter Score
Fasting insulin ≥ 12.2 micro units/ml 20
FPG 100 to 125 mg/dl 10
FPG ≥ 126 mg/dl 20
PPPG 140 to 199 mg/dl 10
PPPG ≥ 200 mg/dl 20
BMI ≥ 23 kg/sqmt 10
Waist circumference ≥ 90 cms in males ≥ 80 cms in females 10
BP >130/80 mm Hg 10
Fasting triglycerides ≥ 150 mg/dl 10
Total score 100

No IR <50, Mild IR 50 to 60, Moderate IR 70 to 80, Severe IR 90 to 100.

Statically analysis

Study design: An observational study with 200 Type 2 diabetes individuals was undertaken to study the prevalence of Insulin resistance.

Statistical methods: Descriptive statistical analysis has been carried out in the present study. Results on continuous measurements are presented on Mean±SD (Min-Max) and results on categorical measurements are presented in Number (%). Significance is assessed at 5% level of significance. Chi-square/ Fisher Exact test has been used to find the significance of study parameters on categorical scale between two or more groups. 95% Confidence Interval has been computed to find the significant features. Diagnostic statistics viz. Sensitivity, Specificity, PPV, NPV and Accuracy have been computed to find the correlation of Indirect method to assess IR and KIER scoring system to assess the IR, Single proportion Z test has been used to find the significance of proportion of Positive IR with duration of disease.

Statistical software: The Statistical software namely SAS 9.2, and R environment ver.2.11.1 were used for the analysis of the data and Microsoft word and Excel have been used to generate graphs, tables etc.

Results

The study comprised of 200 type 2 diabetes subjects.

Table 2 shows the age group of diabetes subjects ranging from 26 to 85 years. 46.5% of diabetes subjects had hypertriglyceridemia. Family history was positive in 50% of patients. One parent was diabetic in 35% and both parents were diabetic in 15% of patients.

Table-2: Age distribution of patients studied.

Age in years Number of patients %
21-30 3 1.5
31-40 23 11.5
41-50 51 25.5
51-60 79 39.5
61-70 35 17.5
71-80 6 3.0
>80 3 1.5
Total 200 100.0

Mean ± SD: 53.47±11.32

Table 3 shows that 69.5% were males and 30.5% were females.

Table-3: Gender distribution of patients studied.

Gender Number of patients %
Male 139 69.5
Female 61 30.5
Total 200 100.0

Table 4 shows that BMI of diabetes subjects range from 18 to 42.

Table-4: BMI (kg/m2) distribution of patients studied.

BMI (kg/m2) Number of patients %
18-25.0 62 31.0
25.0-30.0 104 52.0
>30.0 34 17.0
Total 200 100.0

Mean ± SD: 26.75±4.47

Table 5 shows that Duration of diabetes of subjects range from 0 to 20 years.

Table-5: Duration of disease of patients studied

Duration of disease Number of patients %
New cases 21 10.5
Up to 1 year 22 11.0
1-2 years 22 11.0
2-5 years 46 23.0
5-10 years 55 27.5
10-20 years 26 13.0
>20 years 8 4.0
Total 200 100.0

The ROC analysis was done for KIER scoring system in relation to HOMA1 and it was found that at KIER score >50 the sensitivity and specificity to detect insulin resistance was 94.4 and 65.44 respectively. So KIER score >50 were used as the cut off point for diagnosing insulin resistance (Table 6).

Table-6: ROC analysis for KIER scoring system in relation to HOMA1

KIER Cut-off score Sensitivity Specificity
0 100 0
>0 100 1.33
>10 100 4
>20 100 12
>30 99.2 28
>40 96.8 42.67
>50 94.4 65.33
>60 72 88
>70 50.4 96
>80 27.2 100
>90 10.4 100
>100 0 100

ijmrr_1081_01.jpg

Area under Curve is 0.893 (95%CI: 0.84-0.93)

Figure 1: ROC curve comparing KIER Scoring system with HOMA 1

Diagnostic values based on Area under curve

0.9 to 1--- Excellent test

0.8 to 0.9 --- Good test

0.7 to 0.8---Fair test

0.6 to 0.7--- Poor test

0.5 to 0.6---Fail

The sensitivity and specificity of KIER scoring system was compared with all the indirect methods of estimating insulin resistance and the results are shown in Table 7.

Table-7: Diagnostic test analysis for KIER scoring system

Tests Sensitivity Specificity PPV NPV Accuracy P value
KIER>50 vs HOMA1>2.7 94.40 65.33 81.94 87.50 83.50 <0.001**
KIER>50 vs QUICKI<0.33 92.91 64.38 81.94 83.93 82.50 <0.001**
KIER>50 vs HOMA2>1.8 98.39 39.86 42.36 98.21 58.00 <0.001**
KIER>50 vs FI>12.2 97.30 42.85 50.00 96.43 63.00 <0.001**

+ Suggestive significance (P value: 0.05<P<0.10)

* Moderately significant (P value: 0.01<P £ 0.05)

** Strongly significant (P value: P £0.01)


HOMA 1, QUICKI, HOMA2 and fasting insulin levels are indirect methods of estimating insulin resistance. HOMA 1 and QUICKI showed that 63% and 63.5% of patients were insulin resistant. HOMA 2 and fasting insulin levels showed that 33.5% and 37.5% of patients were insulin resistant. These indirect methods were compared with KID scoring system. KIER scoring system detects insulin resistance in 82% of type 2 diabetes patients (Table 8).

Table-8: Prevalence of Insulin resistance by Indirect Methods.

Prevalence of IR Number of patients (n=200) %
HOMA1-IR>2.6 126 63.0
QUICKI-IR<0.33 127 63.5
HOMA2-IR>1.8 67 33.5
FI>12.2 75 37.5

Insulin resistance was further classified as mild (50 to 60), moderate (70 to 80) and severe (90 to 100) insulin resistance by KIER scoring system. In this study 35.5% had mild, 29.5% had moderate and 17% had severe insulin resistance (Table 8).

Table-8: Prevalence of Insulin resistance by KIER Simple Scoring system

Prevalence of IR Number of subjects (n=200) %
IR-Absent 36 18.0
IR-Present 164 82
Mild 71 35.5
Moderate 59 29.5
Severe 34 17

Discussion

Diabetes mellitus is strongly associated with insulin resistance. Insulin resistance plays an important role in the pathophysiology of diabetes and is associated with obesity and other cardiovascular risk factors. Insulin resistance is defined with a higher level of insulin and glucose (higher level of HOMA-IR and lower level of QUICKI).

1HOMA-IR and QUICKI are two popular indices commonly used to diagnose the insulin resistance based on fasting serum insulin and glucose. HOMA-IR is also a simple, minimally invasive tool that almost accurately predicts insulin resistance. Chen, Sullivan, & Quon (2005) showed log HOMA-IR and QUICKI are among the best indices for distinguishing insulin sensitivity [13, 14, 15].

The goal of this study is to evolve a simple scoring system to estimate insulin resistance in type

2 diabetes patients and to compare this with other indirect methods of measurement of insulin resistance. Type 2 diabetes patients with varied duration of diabetes were analyed.

Various methods are used for the measurement of insulin resistance. Because of infeasibility of Euglycemic insulin clamp test to be done for measuring insulin resistance, which is regarded as a gold standard test in research, various studies [16, 17] across the globe have regarded Homeostasis Model Assessment (HOMA) method to be the gold standard test for measuring insulin resistance in clinical practice and population based research studies.

Nevertheless, it had been demonstrated that there was a strong positive correlation between HOMAIR and Euglycemic insulin clamp-IR in type-2 diabetic subjects, as reported by Emoto et al [17] and Matthews et al. [18] in their studies. So, in the present study, HOMAIR has been used as standard method for measuring insulin resistance. KIER scoring system has been compared with HOMA 1 using ROC curve.

QUICKI and HOMA-IR were highly correlated with clamp-IR with comparable coefficients in both normal range weight and moderately obese type 2 diabetes subjects and non-diabetics as per Yokoyama et al [19]. Of the alternatives to the glucose clamp method for estimating insulin sensitivity in vivo that was examined in this study, QUICKI had the best overall linear correlation with the gold standard clamp measurement.

In contrast to the multiple frequent blood samples and the lengthy time course required for both the glucose clamp and the minimal model approach, QUICKI can be obtained from a fasting blood sample. In addition, the ability to calculate QUICKI does not depend on a robust insulin secretory capacity and were able to use this method to estimate insulin sensitivity for all of our diabetic subjects.

QUICKI is a novel, simple, accurate, and reproducible method for determining insulin sensitivity in humans that may be a useful tool in large epidemiological investigations that study the role of insulin resistance in the pathophysiology of important public health problems such as obesity, cardiovascular diseases, and diabetes [20]. QUICKI demonstrates good correlation with the gold standard method of hyperinsulinemic euglycemic clamp.


So, in the present study QUICKI has been used as standard method for estimating insulin resistance.

Lukshmy M. Hettihewa et al in their study in 42 type 2 diabetes patients with duration less than 6 months have shown that 81% were insulin resistant by fasting insulin and McA, 93% were detected as insulin resistant by HOMA1 and QUICKI [21]. There are very few studies of detecting prevalence of insulin resistance in type 2 diabetes patients while most of the studies aim at detecting insulin resistance in general population.

This study shows that HOMA 1 and QUICKI are identical and similarly HOMA 2 and fasting insulin levels are almost identical. KIER scoring system can be used only in type 2 diabetes patients as more importance was given to fasting and post prandial blood glucose which helps in providing correction for patients with beta cell dysfunction.

Both beta cell dysfunction and insulin resistance lead to persistent hyperglycemia which characterizes type 2 diabetes. Many of the susceptibility genes associated with type 2 diabetes by genome-wide investigations (GWAS) were identified as regulators of cell turnover or regeneration.

Most risk variants for type 2 diabetes in healthy populations act through impairing insulin secretion (resulting in beta cell dysfunction) rather than insulin action (resulting in insulin resistance) which establishes that inherited abnormalities of beta cell function or mass (or both) are critical precursors in type 2 diabetes. Beta cell dysfunction is more severe than insulin resistance.

Beta cell physiology should be preserved throughout life but is adversely impacted with aging and altered metabolic states such as obesity that requires a sustained increase in insulin. Insulin resistance promotes beta cell demise and inhibits beta cell compensation which thereby promotes beta cell dysfunction [22].

Beta cell function decline in type 2 diabetes patients as the duration of diabetes increases, so the fasting insulin levels are decreased. HOMA1, QUICKI, HOMA2 and fasting insulin levels under estimate insulin resistance as the duration of diabetes increase. The KIER scoring system is more sensitive in detecting insulin resistance.

KIER scoring system is also cost effective as the fasting insulin level costs less than INR500 and all other tests are done routinely in diabetes subjects.

Limitations of the study

  1. Hyperinsulinemic and euglycemic clamp was not performed. KIER scoring system has to be evaluated by comparing with clamp studies.
  2. All type 2 diabetes subjects were on regular treatment by oral drugs which may reduce insulin resistance.

Conclusions

KIER scoring system detects insulin resistance in 82% of type 2 diabetes individuals. KIER scoring system had a statistically significant correlation with HOMA and QUICKI indices.

What the study adds to the existing knowledge?

HOMA 1 and QUICKI are identical and similarly HOMA 2 and fasting insulin levels are almost identical in estimation of insulin resistance. The KIER scoring system designed is very simple and economical. It takes into consideration the different factors which contribute to insulin resistance.

Abbreviations used

KIER-KARNATAKA INSTITUTE OF ENDO-CRINOLOGY AND RESEARCH.

BMI—BODY MASS INDEX.

DD—DURATION OF DIABETES.

BP—BLOOD PRESSURE.

FPG --- FASTING PLASMA GLUCOSE.

WCR—WAIST CIRCUMFERENCE.

TC – TOTAL CHOLESTRAL.

TG – TRIGLYCERIDES.

LDL-- LOW DENSITY LIPOPROTEIN.

HDL – HIGH DENSITY LIPOPROTEIN.

PPPG – POST PRANDIAL PLASMA GLUCOSE.

HOMA – HOMEOSTASIS MODEL ASSESMENT.

QUICKI—QUANTITATIVE INSULIN SENSITIVITY CHECK INDEX.

Acknowledgement: Author would like to acknowledge Dr. K.P. Suresh, Scientist (Biostatistics), National Institute of Animal Nutrition & Physiology, Bangalore-560030


Reference

  1. Kronenberg H. Williams textbook of endocrinology. Elsevier Health Sciences. 2007 Nov 30.
  2. Ascaso JF, Pardo S, Real JT, Lorente RI, Priego A, Carmena R. Diagnosing insulin resistance by simple quantitative methods in subjects with normal glucose metabolism. Diabetes Care. 2003;26(12)3320-3325.
  3. Matsuda M. Measuring and estimating insulin resistance in clinical and research settings. Nutr Metab Cardiovasc Dis. 2010;20(2)79-86.
  4. Ferrannini E, Mari A. How to measure insulin sensitivity. J Hypertens. 1998;16(7)895-906.
  5. Bergman RN, Finegood DT, Ader M. Assessment of insulin sensitivity in vivo. Endocr Rev. 1985;6 (1)45-86.
  6. Geloneze B, Vasques AC, Stabe CF, Pareja JC, Rosado LE, Queiroz EC, et al. HOMA1-IR and HOMA2-IR indexes in identifying insulin resistance and metabolic syndrome- Brazilian Metabolic Syndrome Study (BRAMS). Arq Bras Endocrinol Metabol. 2009;53(2)281-287.
  7. Menik L, Palangasinghe S. Comparison of insulin resistance by indirect methods-HOMA, QUICKI and McAuley-with fasting insulin in patients with type 2 diabetes in Galle, Sri Lanka- A pilot study. Online Journal of Health and Allied Sciences. 2006;5(1)1-8.
  8. Yokoyama H, Emoto M, Fujiwara S, Motoyama K, Morioka T, Komatsu M, et al. Quantitative insulin sensitivity check index and the reciprocal index of homeostasis model assessment in normal range weight and moderately obese type 2 diabetic patients. Diabetes Care. 2003;26(8)2426-2432.
  1. McAuley KA, Williams SM, Mann JI, Walker RJ, Lewis- Barned NJ, Temple LA, et al. Diagnosing insulin resistance in the general population. Diabetes Care. 2001;24(3)460-464.
  2. HOMA calculator release 12 December 2007 diabetes trials unit the oxford centre for diabetes. Endocrinology and metabolism. .
  3. Mykkänen L, Haffner SM, Rönnemaa T, Bergman RN, Laakso M. Low insulin sensitivity is associated with clustering of cardiovascular disease risk factors. Am J Epidemiol. 1997;146(4)315-321.
  4. Lima NK, Abbasi F, Lamendola C, Reaven GM. Prevalence of insulin resistance and related risk factors for cardiovascular disease in patients with essential hypertension. American journal of hypertension. 2009;22(1)106-111.
  5. Motamed N, Miresmail SJ, Rabiee B, Keyvani H, Farahani B, Maadi M, et al. Optimal cutoff points for HOMA-IR and QUICKI in the diagnosis of metabolic syndrome and non-alcoholic fatty liver disease- A population-based study. J Diabetes Complications. 2016;30(2)269-274.
  6. Chen H, Sullivan G, Quon MJ. Assessing the predictive accuracy of QUICKI as a surrogate index for insulin sensitivity using a calibration model. Diabetes. 2005;54(7)1914-1925.
  7. Singh B, Saxena A. Surrogate markers of insulin resistance- A review. World J Diabetes. 2010;1(2)36-47.
  8. Mastsude M, Defronzo RA. In vivo measurement of insulin sensitivity in humans clinical research in diabetes and Obesity. 1997;1;23-65.

  1. Emoto M, Nishizawa Y, Maekawa K, Hiura Y, Kanda H, Kawagishi T, et al. Homeostasis model assessment as a clinical index of insulin resistance in type 2 diabetic patients treated with sulfonylureas. Diabetes Care. 1999;22(5)818-822.
  2. Matthews DR, Hosker JP, Rudenski AS, Naylor BA, Treacher DF, Turner RC. Homeostasis model assessment- insulin resistance and beta-cell function from fasting plasma glucose and insulin concentrations in man. Diabetologia. 1985;28(7)412-419.
  3. Radziuk J. Insulin sensitivity and its measurement- structural commonalities among the methods. J Clin Endocrinol Metab. 2000;85(12)4426-4433.
  1. Katz A, Nambi SS, Mather K, Baron AD, Follmann DA, Sullivan G, et al. Quantitative insulin sensitivity check index- a simple, accurate method for assessing insulin sensitivity in humans. J Clin Endocrinol Metab. 2000;85(7)2402-2410.
  2. Hettihewa LM, Palangasingle S, Jayasinghe SS. Comparison of insulin resistance by indirect methods-HOMA, QUICKI And McAuley-with fasting insulin in patients with type2 diabets in Galle, Serilanka- a pilot study. OJHAS. 2006;5(1).
  3. Cerf ME. Beta cell dysfunction and insulin resistance. Front Endocrinol (Lausanne). 2013;4;37.