E-ISSN:2320-8686
P-ISSN:2321-127X

Research Article

Diabetes

International Journal of Medical Research and Review

2019 Volume 7 Number 4 July-August
Publisherwww.medresearch.in

Comparative analysis of biochemical parameters and gene expressions of novel markers in type II Diabetes mellitus

Khot V.1, Kulkarni J.2, Yadav K.3*
DOI: https://doi.org/10.17511/ijmrr.2019.i04.09

1 V.V. Khot, Bharati Vidyapeeth Dental College, Navi Mumbai, Maharastra, India.

2 J. M. Kulkarni, Vaidik Dental College and Research Centre, Daman, India.

3* K.S. Yadav, School of Medicine, D.Y. Patil University, Navi Mumbai, Maharastra, India.

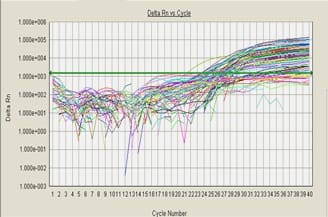
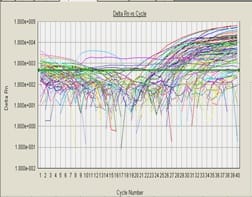
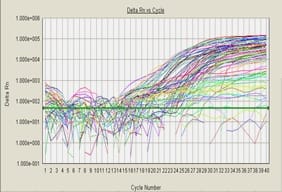
Background: Diabetic nephropathy (DN) is the most common cause of end stage renal disease (ESRD). Early detection of the disease and treatment of this chronic complication which would reduce the medical and economic burden. Early detection of kidney injury by evaluating gene expressions of Il-6, Il-10, LDLr, and CD36 in T2DM with pre-ESRD microalbuminuria minimizes the risk of DN. Methods: Present research work conducted at the Department of Biochemistry, School of Medicine, Navi Mumbai. This study includes 241 subjects (118 male, 123 women, and age ranges 30-70 years) were included after screening for T2DM by measurement of blood glucose in fasting, post-prandial, glycosylated haemoglobin. Microalbumin in urine and e-GFR is measured to eliminate patients of ESRD. Subjects were recruited after written consent and enrolled as per inclusion/exclusion criteria. Categorization of subjects in three study groups; group I (30-45 years), group II (46-70 years) were done on the basis of T2DM duration 3-6 years, glycosylated haemoglobin level (HbA1c) ≥ 7.0% with fasting blood glucose ≥126 mg/dl) and microalbuminuria (30-300 mg/dl) in study group, equal numbers of healthy volunteers enrolled in control group. Blood samples were processed for other renal parameters and RT-PCR to check expressions of novel genes Results: In study groups all renal, lipids parameters are within normal range except albumin/creatinine ratio (p <0.012), e-GFR (p <0.00) and cholesterol (p <.00). Descriptive analysis showed high significance (p <.00) of delta CT gene expressions, parameters in pre-ESRD microalbuminuria subjects. Conclusion: Screening biochemical renal parameters are not enough to prevent DN even in microalbuminuria. Early detection of gene expressions of novel biomarkers predicts risk of kidney injury. Early intervention may prevent morbidity and mortality of kidney due to diabetic nephropathy.

Keywords: Diabetes mellitus, Microalbuminuria, Gene expressions, Risk prediction

Corresponding Author How to Cite this Article To Browse
K.S. Yadav, School of Medicine, D.Y. Patil University, Navi Mumbai, Maharastra, India.
Email:
Khot VV, Kulkarni JM, Yadav KS. Comparative analysis of biochemical parameters and gene expressions of novel markers in type II Diabetes mellitus. Int J Med Res Rev. 2019;7(4):309-314.
Available From
https://ijmrr.medresearch.in/index.php/ijmrr/article/view/1074

Manuscript Received Review Round 1 Review Round 2 Review Round 3 Accepted
2019-03-20 2019-03-30 2019-04-07 2019-04-11
Conflict of Interest Funding Ethical Approval Plagiarism X-checker Note
No Nil Yes 4%

© 2019 by V.V. Khot, J. M. Kulkarni, K.S. Yadav and Published by Siddharth Health Research and Social Welfare Society. This is an Open Access article licensed under a Creative Commons Attribution 4.0 International License https://creativecommons.org/licenses/by/4.0/ unported [CC BY 4.0].

Introduction

About 10 to 40% Type 2 diabetes (T2DM) and 30% Type 1 diabetes (T1DM) suffer from kidney failure increases huge financial burden for care for patients [1]. Conventional biomarkers for kidney damage include glomerular filtration rate (GFR), serum/plasma creatinine, blood urea nitrogen (BUN), urinary micro-albumin excretion and several urinary findings such as proteinuria and haematuria. IL-6 mRNA expression and insulin resistance were found to have a significant correlation and increased plasma IL-6 levels with higher risk of T2DM [2-5]making it an appealing candidate gene. Mesangial cells are the major local source of IL-10 in the normal adult kidney and elevated levels found in diabetic patients [6-7].

CD 36 protein was markedly increased in proximal tubules in human DN [8]. An increased accumulation of cholesterol through the dysregulation of LDL receptor in human mesangial cells has vital role in the progression of renal dysfunction [9]. Though these biomarkers played vital for early detection of DN extensive research in pre-ESRD microalbuinuria in needed. In order to advance these efforts, genetic expressions of novel plasma biomarkers IL-6, IL-10, LDLr and CD 36 were needed for early detection of renal injury and to identify risk for progression of renal dysfunction towards ESRD.

Material and Methods

Place of study: Present research conducted at Department of Biochemistry, Dr D. Y. Patil University, Navi Mumbai.

Sampling method: Patients referred to diabetic clinic were recruited in this study.

The enrolled patients were distributed into 3 different groups; subjects of T2DM between ages 30-45 years; subjects of T2DM between 46-70 years and healthy volunteers (Non-diabetic) between 30-70 years.

T2DM of diabetes age between 3-6 years, HbA1c ≥ 7.0%, pre-prandial blood glucose (FBS) ≥ 6.0 mmol/L (126 mg/dl), post-prandial glucose (PPBS) ≥ 8.0 mmol/L (200 mg/dl) and micro-albuminuria (MALB) ≥ 300 mg/dl were included in this study.

Inclusion criteria:

  • Subjects satisfying above criteria were included in the study but

Exclusion criteria:

  • Subjectssufferings with chronic co-morbidities were excluded from the study.

Renal and lipid parameters (blood urea, serum creatinine, urine creatinine and low-high density lipoprotein’s, cholesterol and triglycerides) were measured and e-GFR, albumin-creatinine ratio were calculated. 3 ml whole blood collected for gene expressions of selected genes separately. All biochemical renal parameters were measured by Dade Dimension dry chemistry auto-analyser (Roche Diagnostics) and gene expressions measured by RT-PCR.

Consent- All authors declare that ‘written informed consent was obtained from patients for publication of outcome of this study’ copy of written consent may retrieve from us, if required.

Ethical approval- The topic was approved by the appropriate ethics committee and has therefore been performed in accordance with the ethical standards laid down in the 1964 Declaration of Helsinki.’

Statistical analysis: Biochemical & gene expression data was analysed by R software & P value or descriptive value was calculated. Institutional ethics committee granted permission for this research work.

Results

Table-1: Descriptive statistics for age, duration and gender distribution of study population.

Descriptive statistics for age and duration of diabetes
Parameters N Mean SD SEM Min Max
Age Control 81 46.26 9.400 1.051 29 68
30-45 years 80 40.01 3.892 0.435 32 45
46-70 years 80 59.38 8.278 0.919 46 70
Duration of diabetes Control NA NA NA NA NA NA
30-45 years 80 3.49 0.729 0.082 3 6
46-70 years 80 6.67 1.213 0.157 3 5.9
Gender Group cross tabulation
Parameters Control 30-45 46-70 Total
Gender Male Count 33 38 47 118
Percentage 40.7 47.5 58.7 49
Female Count 48 42 33 123
Percentage 59.2 52.5 41.2 51
Total count 81 80 80 241

Table-2: Post hoc statistical analysis (P-value) of lipid profile in study population.


Dependent variable Control group I (30-70 yrs) Study Group II (30-45 yrs) Study Group III (46-70 yrs)
30-45 years 46-70 years Control 46-70 years Control 30-45 years
Cholesterol(T) 0.070 0.070 0.070 0.070 0.070 0.070
Triglyceride 0.086 0.086 0.086 0.086 0.086 0.086
LDL 0.00 0.00 0.00 0.00 0.00 0.00
HDL 0.00 0.00 0.00 0.071 0.00 0.071

Gender wise distribution of subjects shown in Table 1. There is marginal percentage difference in all groups since it is cross sectional subject recruitment. Table 2 represented no significant p-value for any lipid parameters.

Since criteria of subjects is pre-nephrotic condition and duration of diabetic is 1-3 years, may be majority of population could be health conscious or possibilities of lipolysis for energy sustainability. In the present study, nutritional and BMR assessment was not performed, otherwise authors might have been able put light on this observation.

Discussion

In lipid parameters we have observed significant p value of LDL in both the study groups. Study published by Sanas S [10] and Essam Abd-Allha [11] states that LDL is correlated with the incidence and severity of diabetic nephropathy in T2DM patients.

Author expressed that outcome of their study should be considered as a potential risk factor and as a diagnostic biomarker to be used in conjunction with other biochemical markers for early diagnosis, assessment.

In the post hoc analysis of gene expressions and lipid in study population (Table 2) showed similar results documented by Hirano T, [12] in their study detected high prevalence of LDL in type II diabetic patients with nephropathy. In1994, Sekizuka [13] reported that serum levels of IL-6 were significantly higher in patients with T2DN than the levels observed in diabetic patients without nephropathy [14].

These observations suggests that IL-6 cytokine may play a role in the pathogenesis of DN. Similar findings have been noted in the present study which showed IL-6 gene is expressed in the study group with high significance (Figure 1).

Fig-1: RT- PCR Quantification of IL6

ijmrr_1074_01.jpg

Table-3: Correlation of glycosylated hemoglobin (</=5.7%) and microalbumin with other novel gene and biochemical parameters.

Parameters Statistical test HbA1C Microalbumin
Delta CT of IL6 Pearson correlation -0.604** -0.193**
p-value 0.000 0.003
Delta CT of IL10 Pearson correlation -0.568** -0.177**
p-value 0.000 0.006
Delta CT of CD36 Pearson correlation -0.534** -0.150*
p-value 0.000 0.02
Delta CT of LDLr Pearson correlation -0.076 -0.026
p-value 0.24 0.691
Urine creatinine mg/dl Pearson correlation 0.311** 0.721**
p-value 0.000 0.000
Blood creatinine Pearson correlation 0 -0.041
p-value 1 0.522
e-GFR Pearson correlation 0.076 0.028
p-value 0.239 0.665

Table 3 represented significant correlation between all the parameters except LDLr. Comparison of glycosylated hemoglobin with all genes showed significant correlation in all parameters except LDLr. A microalbumin comparison with gene expressions of IL-6, IL-10, CD36 and LDLr shows significant P-value (Table 3 and Figure1-4).

ijmrr_1074_02.jpg


Figure-2: RT- PCR Quantification of IL10

ijmrr_1074_03.jpg

Figure-3: RT- PCR Quantification of CD-36

ijmrr_1074_04.jpg

Figure-4: RT- PCR Quantification of LDLr

Authors Parisa Behzadi [15], Nakhjavani [16], Khot VV [17] studied two groups of diabetic patients consisting of patients with microalbuminuria and those with normal albumin excretion. In care of renal parameters there is no significant correlation found except microalbuminuria.

Conclusion

In conclusion, the present results suggested that for early detection of renal injury by analysing routine renal investigations (blood urea nitrogen and serum/ urine creatinine) are not enough to understand the progression of the disease.

Though GFR, micro albumin and urine albumin they play important role in diagnosis, reversion of renal dysfunction at early stage is impossible. Due to lethal conditions more than 60-70 % uncontrolled T2DM subjects demonstrate some degree of renal dysfunction.

The novel gene markers studied showed that their expressions alarm damage to kidney. Early evaluation of these gene expressions by RT-PCR may prevent morbidity and mortality.

Author’s contribution

Dr. Varsha Khot: Research topic design, approval.

Dr. J.M. Kulkarni: Conducted experiments.

Dr. KS Yadav: Supervision, protocol setup and data analysis and writing of manuscript done.

Acknowledgement

Author’s would like to express sincere thanks to medical administrators, faculties and staff of D. Y. Patil Medical College, Navi Mumbai. Special thanks to the subjects who have participated in this research work, without their participation, this project would not have been completed.

Reference

  1. Bethesda MD. United States Renal Data System, USRDS2007 Annual Data Report- National Institute of Diabetes and Digestive and Kidney Diseases, National Institutes of Health. US Depa rtment of Health and Human Services. 2007.
  2. Qi L, van Dam RM, Meigs JB, Manson JE, Hunter D, Hu FB. Genetic variation in IL6 gene and type 2 diabetes- tagging-SNP haplotype analysis in large-scale case–control study and meta-analy sis. Human Molecul Genet. 2006;15(11)1914-
  3. Fishman D, Faulds G, Jeffery R, Mohamed-Ali V, Yudkin JS, Humphries S. The effect of novel polymorphisms in the interleukin-6 (IL-6) gene on IL-6 transcription and plasma IL-6 levels, and an association with systemic-onset juvenile chronic arthritis. J Clin Invest. 1998;102(7)1369-76.
  4. Vozarova B, Fernández-Real JM, Knowler WC, Gallart L, Hanson RL, Gruber JD, et al. The interleukin-6 (-174) G/C promoter polymorphism is associated with type-2 diabetes mellitus in Native Americans and Caucasians. Hum Genet. 2003;112(4)409-13.

  1. Kubaszek A, Pihlajamäki J, Komarovski V, Lindi V, Lindström J, Eriksson J, et al. Promoter polymorphisms of the TNF-alpha (G-308A) and IL-6 (C-174G) genes predict the conversion from impaired glucose tolerance to type 2 diabetes- the Finnish Diabetes Prevention Study. Diabetes. 2003;52(7)1872-6.
  2. Mysliwska J, Zorena K, Semetkowska-Jurkiewicz E, Rachon D, Suchanek H, Mysliwski A. High levels of circulating interleukin-10 in diabetic nephropathy patients. Eur Cytokine Netw. 2005;16(2)117-22.
  3. Sinuai I Averbukh Z, Gitelman I, Rapoport MJ, Sandbank J, Albeck M, et al. Mesangial cells initiate compensatory renal tubular hypertrophy via IL-10-induced TGF-beta secretion- effect of the immuno-modulator AS101 on this process. Am J Physiol Renal Physiol. 2006;291(2)F384-94.
  4. Susztak K, Ciccone E, McCue P, Sharma K, Böttinger EP. Multiple metabolic hits converge on CD36 as novel mediator of tubular epithelial apoptosis in diabetic nephropathy. PLoS medicine. 2005;2(2)e45.
  5. Zhang Y, Ma KL, Ruan XZ, Liu BC. Dysregulation of the low-density lipoprotein receptor pathway is involved in lipid disorder-mediated organ injury. Int J Biol Sci. 2016;12(5)569.
  6. Suvarna Sanas, Yadav KS. Gene Expressions and Polymorphisms of Novel Biomarkers in Diabetic Nephropathy. IJBCRR. 2018;21(1)1-9.
  7. Abd-Allha E, Hassan BB, Abduo M, Omar SA, Sliem H. Small dense low-density lipoprotein as a potential risk factor of nephropathy in type 2 diabetes mellitus. Indian J Endocrinol Metab. 2014;18(1)94-8.
  1. Hirano T, Naito H, Kurokawa M, Ebara T, Nagano S, Adachi M, et al. High prevalence of small LDL particles in non-insulin-dependent diabetic patients with nephropathy. Athero. 1996;123(1-2)57-72.
  2. Sekizuka K, Tomino Y, Sei C, Kurusu A, Tashiro K, Yamaguchi Y, et al. Detection of serum IL-6 in patients with diabetic nephropathy. Nephron. 1994;68(2)284-5.
  3. Khot VV, Yadav KS. LDLr Gene Expressions- A Novel Biomarker in Risk Prediction of Renal Injury. IJHSR. 2017;7(3)37-41.
  4. Behzadi P, Torabi F, Amini M, Aminorroaya A. Comparison of ox-LDL levels in diabetic patients with normo-, micro-, and macro albuminuria with their first degree relatives and the healthy control group. Int J Endocrinol. 2012.
  5. Nakhjavani M, Esteghamati A, Khalilzadeh O, Asgarani F, Mansournia N, Abbasi M. Association of macro albuminuria with oxidized LDL and TGF-beta in type 2 diabetic patients- a case-control study. Int Urol Nephrol. 2010;42(2)487-92.
  6. Khot VV, Yadav KS, Patil SB. Expressions of CD36- Predictor marker of the early Kidney Injury in Type 2 Diabetic Mellitus. IOSR-JDMS. 2017;16(3)113-117.